In this article, we explore how to leverage NumPy in data science applications and integrate it with other popular Python libraries. We will cover converting between NumPy arrays and Pandas DataFrames, visualizing data with Matplotlib, and performing advanced scientific computations using SciPy.
1. Integration with Pandas: Converting Between NumPy Arrays and DataFrames
Pandas is a powerful tool for data analysis. By converting NumPy arrays into Pandas DataFrames, you can efficiently perform data cleaning, manipulation, and analysis. Likewise, you can easily convert DataFrames back into NumPy arrays when needed.
Code Example:
import numpy as np
import pandas as pd

# Create a NumPy array
data = np.array([[10, 20, 30],
                 [40, 50, 60],
                 [70, 80, 90]])

# Convert the NumPy array to a Pandas DataFrame
df = pd.DataFrame(data, columns=['Feature 1', 'Feature 2', 'Feature 3'])
print("DataFrame:\n", df)

# Convert the DataFrame back to a NumPy array
data_converted = df.values
print("\nNumPy Array:\n", data_converted)
Expected Output:
DataFrame: Feature 1 Feature 2 Feature 3 0 10 20 30 1 40 50 60 2 70 80 90 NumPy Array: [[10 20 30] [40 50 60] [70 80 90]]
2. Visualization with Matplotlib: Plotting NumPy Arrays
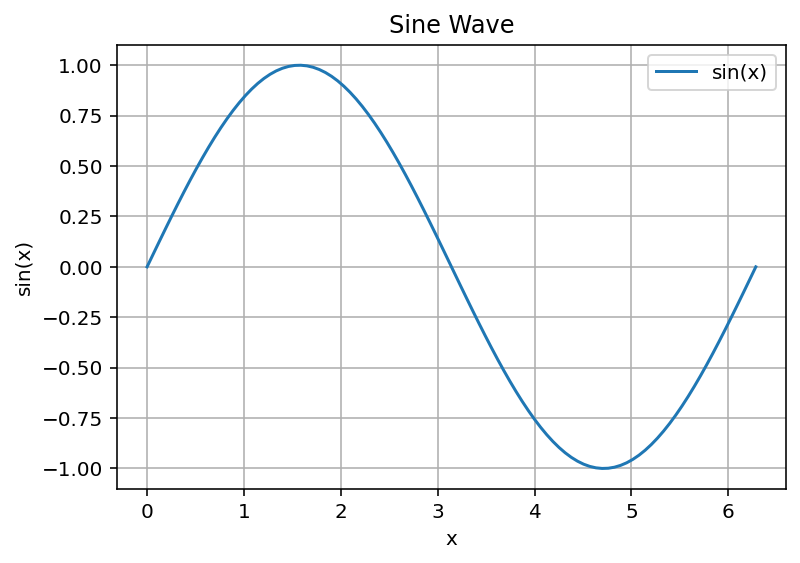
Matplotlib is one of the most popular libraries for data visualization in Python. You can use NumPy arrays to create informative plots and graphs, which help you visually analyze your data. The example below demonstrates how to plot a sine wave.
Code Example:
import numpy as np
import matplotlib.pyplot as plt

# Generate 100 x values from 0 to 2π
x = np.linspace(0, 2 * np.pi, 100)
# Compute sine values for each x
y = np.sin(x)

# Plot the sine wave
plt.plot(x, y, label="sin(x)")
plt.title("Sine Wave")
plt.xlabel("x")
plt.ylabel("sin(x)")
plt.legend()
plt.grid(True)
plt.show()
Expected Output:

The plot displays a smooth sine wave across the interval [0, 2π] on the x-axis.
3. Scientific Computing with SciPy: Advanced Analysis Using NumPy
SciPy builds on the powerful NumPy array structure to perform advanced mathematical and scientific computations. With SciPy, you can tackle tasks such as integration, optimization, and solving differential equations. Below is an example that computes the integral of the sine function over the interval [0, π].
Code Example:
import numpy as np
from scipy import integrate

# Define the function to integrate
def f(x):
    return np.sin(x)

# Compute the integral of sin(x) from 0 to π
result, error = integrate.quad(f, 0, np.pi)
print("Integral of sin(x) from 0 to π:", result)
Expected Output:
Integral of sin(x) from 0 to π: 2.0
Summary
- Pandas Integration: Seamlessly convert between NumPy arrays and DataFrames to enhance your data analysis workflow.
- Matplotlib Visualization: Utilize NumPy arrays to generate clear and informative visualizations of your data.
- SciPy Scientific Computing: Harness the power of SciPy for advanced mathematical computations and analyses based on NumPy.
