In this article, we explore practical applications of NumPy in real-world scenarios. We will cover image processing with pixel arrays, signal processing using time series data filtering, and error debugging by identifying and solving common issues such as dimension mismatches and dtype errors.
1. Image Processing: Working with Pixel Arrays (e.g., Grayscale Conversion)
Image processing often involves manipulating pixel arrays. One common task is converting an RGB image to grayscale. This can be achieved by applying a weighted sum to the red, green, and blue channels. The following example demonstrates how to simulate an RGB image using NumPy and convert it to a grayscale image.
Code Example:
import numpy as np

# Simulate an RGB image with shape (100, 100, 3)
image_rgb = np.random.randint(0, 256, size=(100, 100, 3), dtype=np.uint8)

# Convert to grayscale using the luminosity method
# Grayscale = 0.2989 * R + 0.5870 * G + 0.1140 * B
image_gray = np.dot(image_rgb[...,:3], [0.2989, 0.5870, 0.1140])

print("Grayscale image shape:", image_gray.shape)
Output:
Grayscale image shape: (100, 100)
2. Signal Processing: Filtering Time Series Data
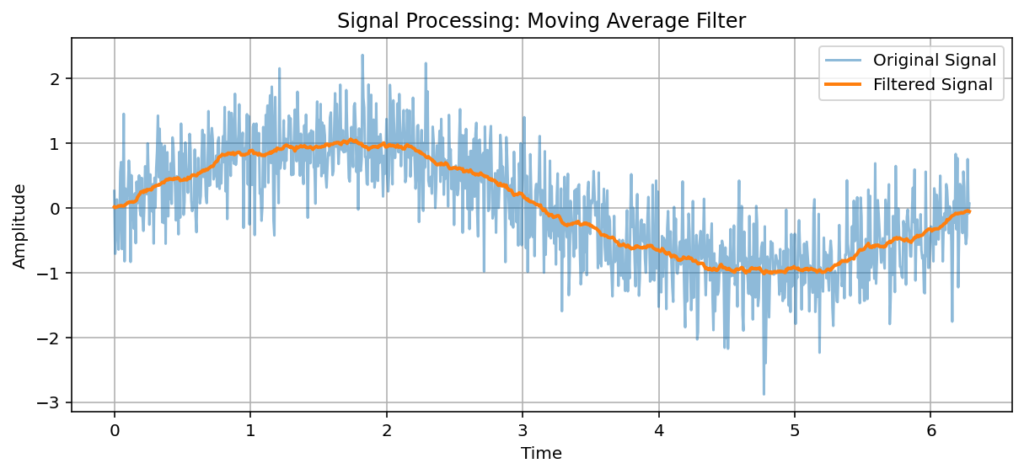
Signal processing is a critical application in many fields. In this example, we generate a noisy sine wave and apply a simple moving average filter to smooth the signal. This approach is often used to reduce noise in time series data.
Code Example:
import numpy as np
import matplotlib.pyplot as plt

# Generate time values and a noisy sine wave signal
t = np.linspace(0, 2 * np.pi, 1000)
signal = np.sin(t) + 0.5 * np.random.normal(size=t.shape)

# Apply a simple moving average filter with a window size of 50
window_size = 50
kernel = np.ones(window_size) / window_size
filtered_signal = np.convolve(signal, kernel, mode='same')

# Plot the original and filtered signals
plt.figure(figsize=(10, 4))
plt.plot(t, signal, label="Original Signal", alpha=0.5)
plt.plot(t, filtered_signal, label="Filtered Signal", linewidth=2)
plt.title("Signal Processing: Moving Average Filter")
plt.xlabel("Time")
plt.ylabel("Amplitude")
plt.legend()
plt.grid(True)
plt.show()
Expected Output:

A plot displaying the original noisy sine wave along with a smoother, filtered version.
3. Error Debugging: Common Errors (Dimension Mismatch, dtype Issues) and Their Solutions
When working with NumPy, you may encounter common errors such as dimension mismatches and dtype issues. The examples below demonstrate these errors and how to handle them using try/except blocks.
Dimension Mismatch Example:
import numpy as np

# Create arrays with incompatible shapes
a = np.array([1, 2, 3])
b = np.array([[1, 2], [3, 4]])

try:
    result = a + b
except ValueError as e:
    print("Dimension Mismatch Error:", e)
Output:
Dimension Mismatch Error: operands could not be broadcast together with shapes (3,) (2,2)
Data Type Issue Example:
import numpy as np

# Create an array of strings
a = np.array(["a", "b", "c"])

try:
    # Attempt to add an integer to a string array
    result = a + 1
except TypeError as e:
    print("Data Type Error:", e)
Output:
Data Type Error: ufunc ‘add’ did not contain a loop with signature matching types (dtype(‘<U1’), dtype(‘int32’)) -> None
Summary
- Image Processing: Use NumPy arrays to manipulate pixel data, such as converting RGB images to grayscale.
- Signal Processing: Apply filters like the moving average to smooth noisy time series data.
- Error Debugging: Identify and resolve common errors such as dimension mismatches and dtype issues to ensure robust code.
